
If you watch the news, you may have heard about large companies, such as 3M and Meta, having laid off huge numbers of workers. At the same time, the monthly jobs report from the Bureau of Labor Statistics continues to show positive job growth. With these two things seemingly at odds with each other, you may wonder what is going on with the job market or how are the national workforce trends impacting our community. One method to answer these questions and used by regional economists is called shift share analysis.
Shift-share analysis is an economic and statistical technique used to analyze the sources of growth or changes in economic indicators, such as employment, income, or output, within a specific geographic area, usually a region or industry. It aims to decompose the overall change into different components to understand how much of the change is due to national trends, regional characteristics, and industry-specific factors.
Shift share analysis is broken into three parts: the national growth share (or national share), the industrial mix share (or industry mix), and the local share (or regional shift). These three components identify the amount of local growth that is attributable to the growth of the national economy overall, the amount of growth that is attributable to the national trends in each sector, and the amount that is unique to the competitive advantage of the region, respectively.
Table 1 shows the shift share analysis for the Duluth/Superior metropolitan statistical area (MSA)—the area including St. Louis County and Carlton Counties in Minnesota and Douglas County in Wisconsin—between 2019 and 2022 for all major sectors of the economy. Although not shown in the table, shift share analysis also requires the analyst to use national-level data to calculate the three components.
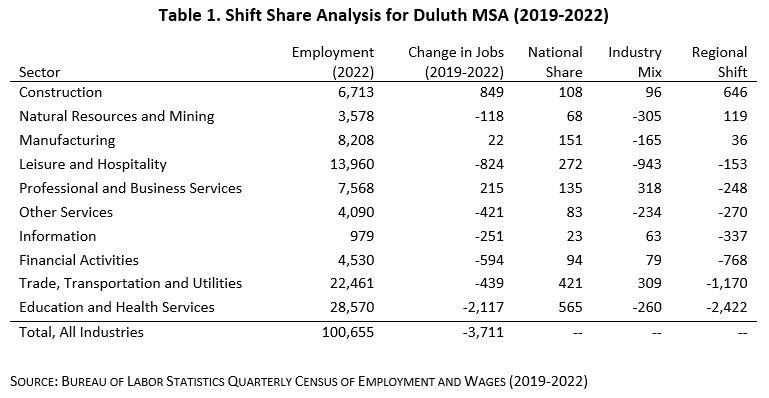
As shown in the column labeled “Change in Jobs,” the MSA lost more than 3,700 jobs overall during the four-year period, likely due to the COVID-19 pandemic. However, there were some bright spots. The construction, manufacturing, and professional and business services sectors all added jobs during the period.
The column labeled “National Share” accounts for the overall growth or change that can be attributed to the national economy's performance. According to the Bureau of Labor Statistics, between 2019 and 2022, the U.S. added 2.3 million jobs nationwide, for a growth rate of 1.8%. Therefore, the national share for each sector represents the number of jobs that would have been added if the local sector had grown at the same rate (1.8%).
The column labeled “Industry Mix” reflects how a region's or industry's particular mix of economic activities contributes to its growth or change. If the region or industry has a higher concentration in rapidly growing sectors, it will experience growth due to this factor. For example, when a specific sector—such as construction or information—experiences rapid growth nationally, we will see that growth reflected in the “Industry Mix” column.
Finally, the column labeled “Regional Shift” accounts for the growth or change that is unique to the specific region being studied. Positive values in this column reflect areas where the region outperformed national employment and industry trends, while negative numbers represent areas where the region performed less well than would be expected given national developments. In the Duluth MSA, the construction, natural resources and mining, and manufacturing industries were all bright spots. Meanwhile, education and health services; trade, transportation, and utilities; and financial activities were the industries where the region saw larger losses than what would be expected given national trends.
This shift share analysis highlights some interesting and surprising facts about the competitiveness of the Duluth metro area and its local industries. While the region as a whole saw job losses between 2019 and 2022, those losses were not surprising given the COVID-19 pandemic. Yet many industries in the area saw employment losses that were larger than what would be expected given national trends. On the other hand, the local manufacturing, mining, and construction industries all outperformed national averages, and reflect areas where the Duluth region may have a competitive advantage.
The next time you read the monthly jobs report or hear about major layoffs in a particular sector (such as information or manufacturing), keep in mind that these national trends can all influence local employment growth—but they might push or pull in opposite directions. Shift share analysis is a tool that can help us understand which national trends are strongest and how an area’s competitive advantage ultimately drives changes in employment locally.